This website displays data from publicly available sources that are featured in the reports linked below. You can either download the reports or visit each report’s landing page (edtrust.org) for more details on how we crunched the numbers, what we found, and what we think policy makers should do about it.
The data for our college affordability report will be uploaded in the web tool soon.
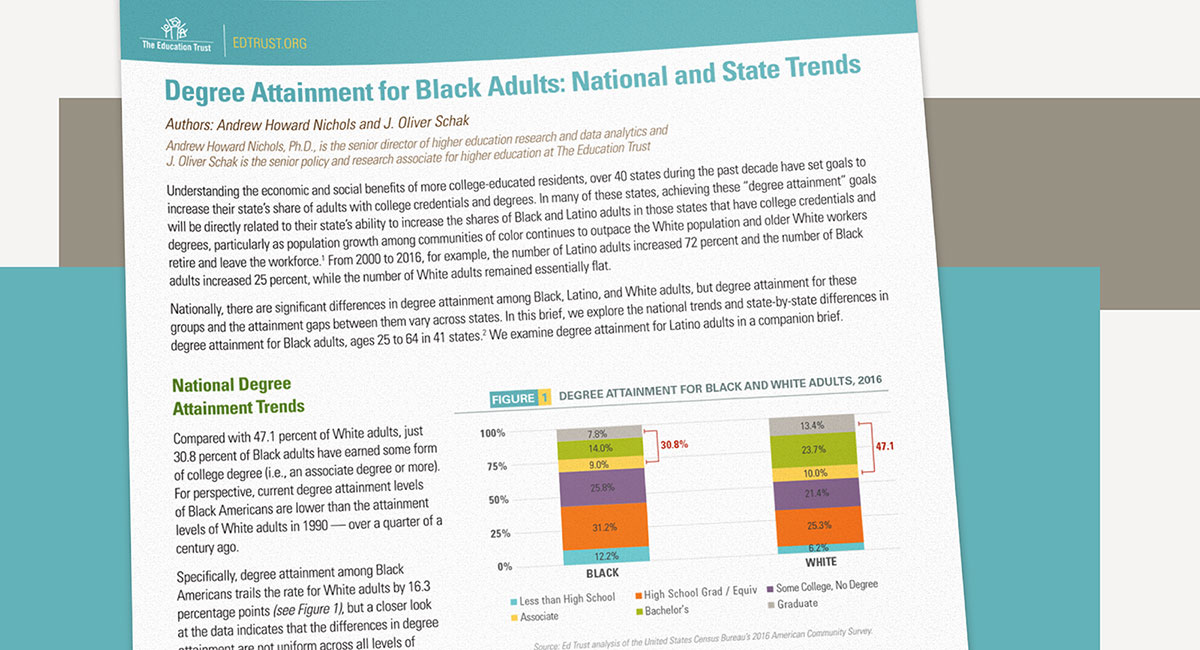
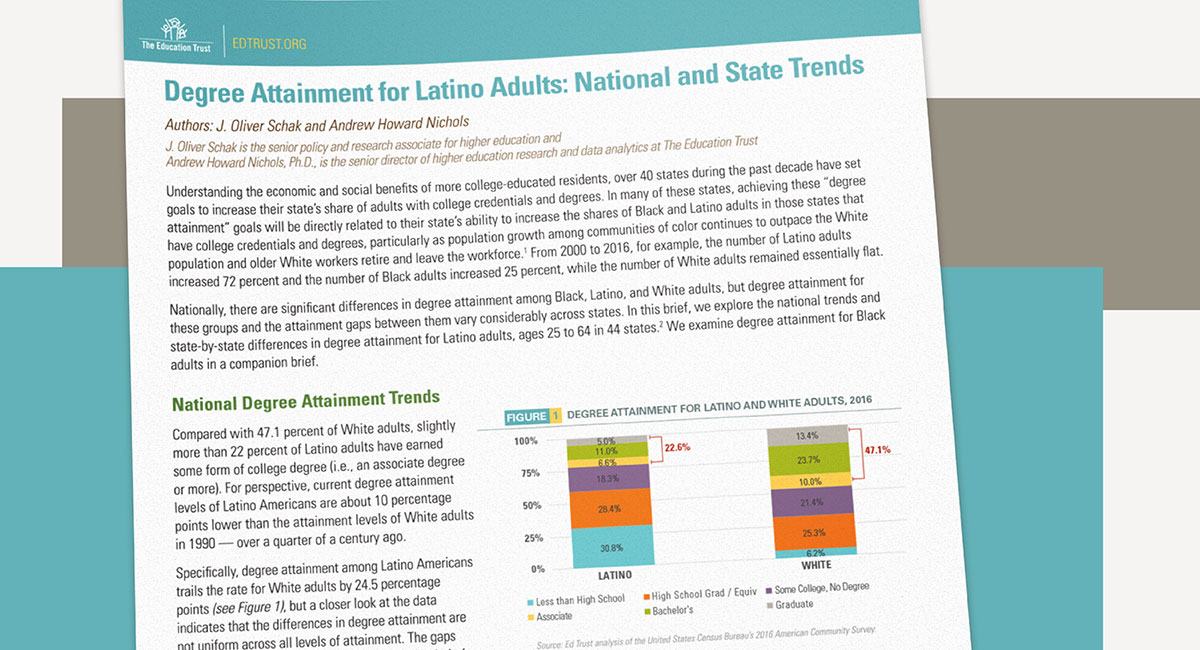
The data examining who has a college degree is called “degree attainment.” Degree attainment examines the percentage of adults in each state that have earned an associate, bachelor’s, or graduate degree. The State Equity Report Card includes 2016 degree attainment rates for Black and Latino residents and changes in Black and Latino degree attainment since 2000.
As part of our Broken Mirrors reports, we examine Black and Latino “enrollment representation” in public higher education. These data focus on each state’s public colleges and universities and communicate how well the percentage of Black and Latino students at these colleges reflects the percentage of Black and Latino residents in that state. These data are provided separately for both a) public four-year institutions and b) community and technical colleges. In addition, we also examine how opportunities to enroll at selective, public institutions in each state differ by race and ethnicity. The enrollment data are for fall 2016.
Also featured in the Broken Mirrors reports, we examine Black and Latino “degree earner representation.” These data focus on each state’s public colleges and universities and communicate how well the percentage of Black and Latino degree associate and bachelor’s degree earners from these colleges mirror the percentage of Black and Latino residents in that state. The State Equity Report Card also compares how the share of Black and Latino graduates who earn a bachelor’s degree compared to White graduates. Degree earner data are for 2016.
As part of our State Equity Report Card, we examine how "affordable" public college is for students from low-income backgrounds. We look closely at just how much beyond their means students from low-income backgrounds are being asked to pay for a college degree at both public four-year institutions and community and technical colleges in each state. We use net price to determine affordability. Net price is the average amount that in-state students from low-income backgrounds pay to attend public institutions, after subtracting grants and scholarships from the cost of attendance. Affordability data are for 2017.